Flutter Charts
A chart is a graphical representation of data where data is represented by a symbol such as a line, bar, pie, etc. In Flutter we can add the fl_chart package.
Supported Chart Types in Flutter
fl_chart supports mainly three types of charts, and each chart comes with their own configuration options:
- Line Chart
- Bar Chart
- Pie and Donut Chart
Line Chart
A line chart is a graph that helps us create lines by connecting two coordinates.
We can use it as below:
LineChart(
  LineChartData(
    // write your logic
  ),
);
Bar Chart
It is a graph that shows data using rectangular bars. These bars can be horizontal or vertical.
We can use it as below:
BarChart(
  BarChartData(
    // write your logic
  ),
);
Pie or Donut Chart
It is a graph that is used to display the information in a circular graph.
We can use it as below:
PieChart(
  PieChartData(
    // write your logic
  ),
);
Let us understand it with the help of an example.
Example
Add the fl_chart in the package.yaml file
dependencies:
  flutter:
    sdk: flutter
  fl_chart: ^0.10.1
After adding the dependency, click on the get packages link shown on the screen’s top left corner:
import 'package:flutter/material.dart';
import 'package:fl_chart/fl_chart.dart';
void main() => runApp(MyApp());
/// This Widget is the main application widget.
class MyApp extends StatelessWidget {
@override
Widget build(BuildContext context) {
return MaterialApp(
home: HomePage(),
);
}
}
class HomePage extends StatelessWidget {
@override
Widget build(BuildContext context) {
return Scaffold(
appBar: AppBar(
title: const Text('Flutter Chart Example'),
backgroundColor: Colors.green
),
body: Center(
child: Column(
mainAxisAlignment: MainAxisAlignment.center,
children: [
LineCharts(),
Padding(
padding: const EdgeInsets.all(16.0),
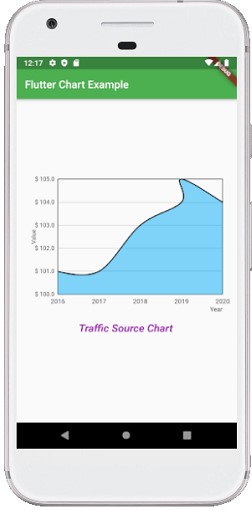
child: Text(
"Traffic Source Chart",
style: TextStyle(
fontSize: 20,
color: Colors.purple,
fontWeight: FontWeight.w700,
fontStyle: FontStyle.italic
)
)
),
],
),
),
);
}
}
class LineCharts extends StatelessWidget {
@override
Widget build(BuildContext context) {
const cutOffYValue = 0.0;
const yearTextStyle =
TextStyle(fontSize: 12, color: Colors.black);
return SizedBox(
width: 360,
height: 250,
child: LineChart(
LineChartData(
lineTouchData: LineTouchData(enabled: false),
lineBarsData: [
LineChartBarData(
spots: [
FlSpot(0, 1),
FlSpot(1, 1),
FlSpot(2, 3),
FlSpot(3, 4),
FlSpot(3, 5),
FlSpot(4, 4)
],
isCurved: true,
barWidth: 2,
colors: [
Colors.black,
],
belowBarData: BarAreaData(
show: true,
colors: [Colors.lightBlue.withOpacity(0.5)],
cutOffY: cutOffYValue,
applyCutOffY: true,
),
aboveBarData: BarAreaData(
show: true,
colors: [Colors.lightGreen.withOpacity(0.5)],
cutOffY: cutOffYValue,
applyCutOffY: true,
),
dotData: FlDotData(
show: false,
),
),
],
minY: 0,
titlesData: FlTitlesData(
bottomTitles: SideTitles(
showTitles: true,
reservedSize: 5,
textStyle: yearTextStyle,
getTitles: (value) {
switch (value.toInt()) {
case 0:
return '2016';
case 1:
return '2017';
case 2:
return '2018';
case 3:
return '2019';
case 4:
return '2020';
default:
return '';
}
}),
leftTitles: SideTitles(
showTitles: true,
getTitles: (value) {
return '\$ ${value + 100}';
},
),
),
axisTitleData: FlAxisTitleData(
leftTitle: AxisTitle(showTitle: true, titleText: 'Value', margin: 10),
bottomTitle: AxisTitle(
showTitle: true,
margin: 10,
titleText: 'Year',
textStyle: yearTextStyle,
textAlign: TextAlign.right)),
gridData: FlGridData(
show: true,
checkToShowHorizontalLine: (double value) {
return value == 1 || value == 2 || value == 3 || value == 4;
},
),
),
),
);
}
}
Example