Matrix Reports In Salesforce
Introduction to Matrix Report:
Matrix Reports are the type of reports allow you to group records both by row and by column. Where you can do comparison of related totals, with totals by both row and column. Use matrix reports when you want to show your data by two different dimensions that aren’t related with each other, such as date and product.
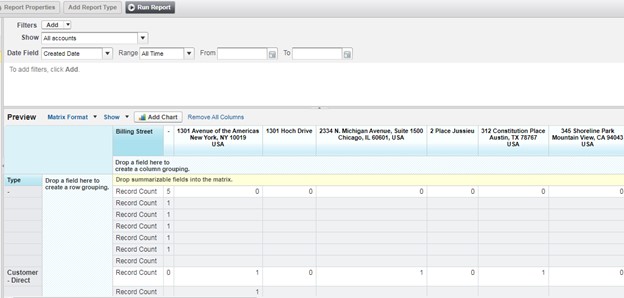
Example: All Accounts for your organization sub totaled by type as row-wise and ‘Billing Street’ as column-wise.
Step 1: After login into Salesforce.com, click on Report Tab and the click on New Report button.

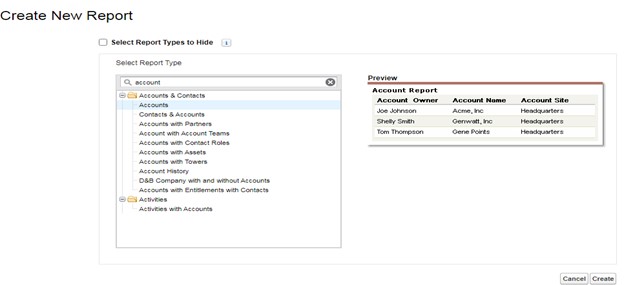
Step 2: Select an object for which you want to create a Report. Here we are selecting Account object and then click Create button.
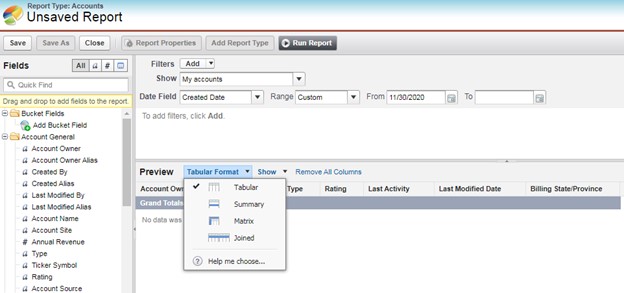
Step 3: Click on ‘Tabular Format’ and click Matrix.
Step 4: Drag any field from left panel; here we have added Type as Field for row-wise grouping and ‘Billing Street’ for column-wise grouping. All records are grouped accordingly as below. Finally Click Save.